|
|
||
|
Testing
|
Viscosity | Curing Monitor Device | Advanced Test Container | |
||
|
Foam Qualification System FOAMAT® Measuring Physical Parameters During Foam Formation |
||
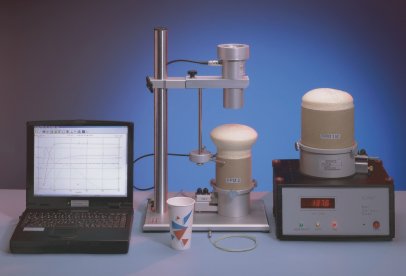 Fig. 1. The foam qualification system FOAMAT with the ultrasonic fan sensor PFT, a thermocouple, and the pressuremeasurement devices FPM 2 and FPM 150. The measurement sequence and the data processing are controlled by the software ,,FOAM” (left). * covered by several
patents |
Simultaneous measurement of foam rise height, reaction temperature, rise pressure, curing, weight loss and viscosity Master curves for quality assurance testing in production control (ISO 9001) Easy to use Windows based FOAM software High performance sensors for all foam, types |
|
|
Foam Testing The quality of polyurethane (PU) foams depends on what happens during their formation. It therefore makes sense to record the formation parameters by suitable means and to check these regularly on representative samples. Consistent product quality is ensured by measuring the formation parameters of samples of starting materials prior to the actual foaming process and to compare them with specified standards in the form of master curves. Many automotive systems suppliers apply this method to vehicle-interior parts and modules. The furniture industry, along with the equipment insulation and construction industries, also measures formation parameters for the purposes of quality assurance. When foam systems with special properties are being developed, measuring the formation parameters gives an insight into how the reaction is proceeding and how foam formation can be affected by additives, blowing agents, stabilizers and the mixing ratio. The Foam Qualification System FOAMAT® meets both stringent requirements on measuring accuracy and versatility in accommodating different sample containers. |
||
|
Rise Height and Rise Profile Measurement The classic method for characterizing foams is to determine the rise height or rise profile by measuring the change in height due to the expansion of the foam sample in a cup, a cardboard box or a cylindrical container. The start time is generally accepted to be the start of the reaction between the mixed components A (polyol + additives) and B (isocyanate) after mixing. The rise time is the time which elapses until maximum expansion has occurred. The patented ultrasonic fan sensor PFT of the FOAMAT® system (Figs. 1, 2) can be used for all types of foams, including rigid foams with large heat release. The rise profile is the fingerprint of a foam. During quality assurance testing, it is compared with given master curves. A master curve (Fig. 3) is a tolerance band showing the margins of the rise profile for a “good” foam sample. Rise height measurement is still the standard test in foam qualification. With the FOAMAT® system new measurement techniques have become available, revealing more detailed information of the foam generation process.
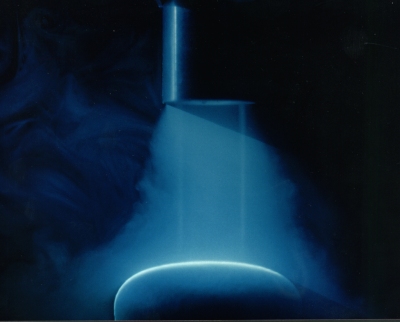
Fig. 2. The patented ultrasonic fan sensor PFT ventilates the surface of the rising foam.
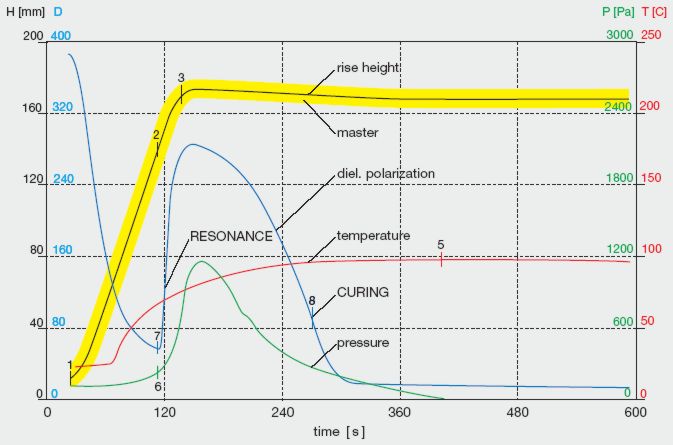
Fig. 3. The experimental data for rise height, temperature, rise pressure, dielectric polarization, and loss of mass are recorded simultaneously by the software FOAM and are displayed in a graph. The figure shows the curves for a semi rigid foam measured with FOAMAT and FPM/CMD2. |
||
|
The exothermal cross linking reaction causes the temperature increase in the foam sample. Thin thermocouples are ideal for measuring the temperature inside the foam because they have a low heat capacity and are easy to handle. They interfere little with the foam formation and can be used repeatedly. |
||
|
Pressure builds up in the foam after the components have set. Stable cell walls are formed that prevent the foam from expanding further and to release blowing agents. Thus, wall elements, panels or sheet metal are stressed at right angles to the direction of foam flow if they are foam backed for the purpose of providing insulation or rigidity. As high pressure forces are generated, the production equipment has to be reinforced or supported. The forces are measured as the rise pressure, so called because the local stress present inside the foam after setting is critically dependent on the foam rise height. The rise pressure is measured with the patented FPM (Foam Pressure Measurement) device. The FPM replaces usual test cups. Whereas the rise curve reflects the dynamics of blowing agent generation, the rise pressure mirrors the cell properties, which are affected by the polymerization reaction. Measuring the pressure can yield important information about the effects of catalysts and stabilizers on the setting reaction. For production purposes, the pressure curve determines the gel point and the pressure decay, which indicates when to open the mould. Since the foam is free to expand upwardly while the pressure is being measured, the ultrasonic fan sensor PFT can measure the rise height simultaneously.
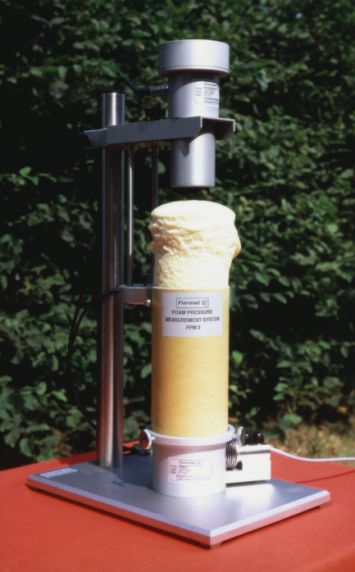
Fig. 4. FPM 2 on the stand of the Foam Qualification System FOAMAT®. |
||
|
A particular advantage of measuring the pressure by the FPM is that it allows the viscosity of the foam to be calculated directly from the experimental data provided by FOAMAT®. This is achieved by using the Hagen-Poisseuille viscosity model. The model starts on the assumption that the viscosity is determined by the force necessary to move a longitudinal element of foam at a specified speed through a tube, which is the FPM in this case. The reaction force is obtained directly from the rise pressure. The pressure data and the rise height curve measured in the FPM are sufficient for calculating the viscosity vs. time. For producers, the viscosity gives additional information for optimizing the process control in moulded foam production. |
||
|
Dielectric Polarization Measurement Dielectric polarization is a new measurement parameter that gives insight into the electrochemical processes occurring during foam formation. Dielectric polarization is essentially determined by chain-like molecules with a large dipole moment due to their polar ends (OH, NCO). Chain formation precedes the crosslinking reaction that ultimately suppresses all dipole mobility during curing. The dielectric polarization sensor CMD (Curing Monitor Device) is located in the bottom section of the FPM (Fig. 5). The dielectric polarization shows the formation of intermediates like polyurea and displays the final curing of the foam giving a constant signal after the chemical reaction is completed. CMD is provided in combination with the pressure measurement device FPM. In order to simulate the production conditions in a mould, the CMD sensor can be heated with closed loop control.
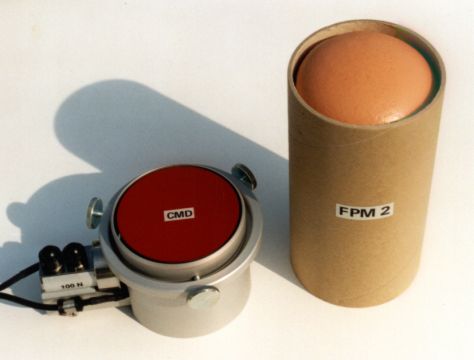
Fig. 5. The polarization sensor CMD which is integrated into the FPM device measures the dielectric polarization of a foam sample simultaneously with the rise pressure. Right: the foam specimen in the removed cardboard cylinder. |
||
|
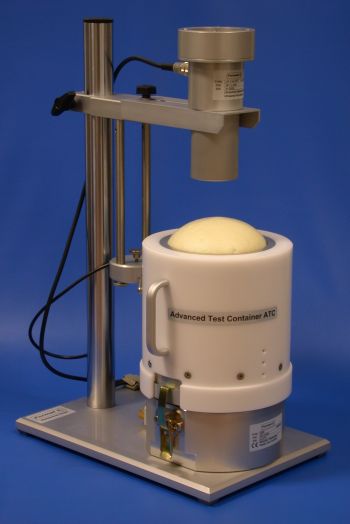
Advanced Test
Container ATC Undefined test container temperatures spoil the correlation between the test result and the production situation. PIR foams require external heat to react and cure properly. Otherwise these formulations remain sticky and voids appear. To overcome this, Format Messtechnik GmbH has introduced the temperature controlled Advanced Test Container ATC (Fig. 6). Another advantage of the new precise temperature controlled test container is the better reproducibility of the measurement data compared to non temperature controlled systems.
Fig. 6. The Advanced Test Container ATC is a temperature controlled test container giving most reproducible and production near test results. |
||
|
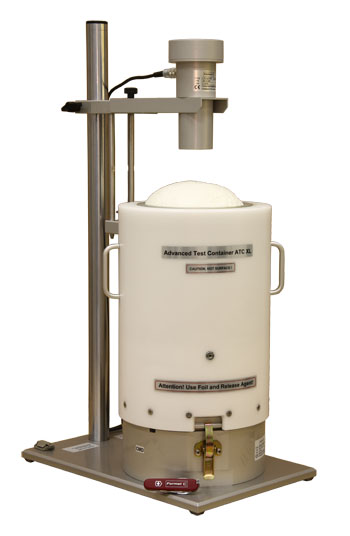
Extra Large Advanced Test
Container ATC XL For testing bigger foam quantities under temperature controlled conditions, Format Messtechnik GmbH has introduced the extra large temperature controlled Advanced Test Container ATC XL (Fig. 7). The ATC XL has four times the test volume of the standard ATC. They both comprise an upper and a lower part, which are clamped by spring locks. The foam sample can easily be recovered through the bottom opening. An additional release mechanism is available.
Fig. 7. The Advanced Test Container ATC XL is placed on the stand of the Foam Qualification System FOAMAT®. The ATC XL has four times the test volume of the standard ATC. |
||
|
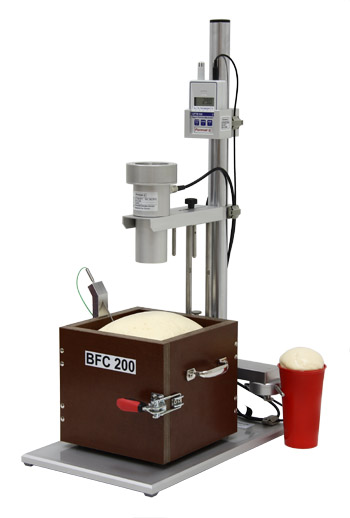
The Box Foam Setup comprises the Box Foam Container BFC 200, the extended mechanical set and a metal sheated thermocouple. The Box Foam Setup is specially designed to measure the rise height and the core temperature of slabstock foam samples. The BFC 200 is made of Pertinax walls forming a cube with an edge length of 200mm. For easy access to the finished foam sample two of the walls are hinged and can be flapped aside. A thermocouple holder is mounted at the upper edge of the BFC 200. It has a boring at an angle of approximately 45 degrees for inserting a thermocouple into the center of the foam. The extended mechanical set is larger than the standard mechanical set and is equipped with a second cup receptacle, turned to the right hand side of the stand.
Fig. 8. The BFC 200 is placed onto the base plate of the extended mechanical set. The thermocouple is inserted into the center of the foam. |
||
|
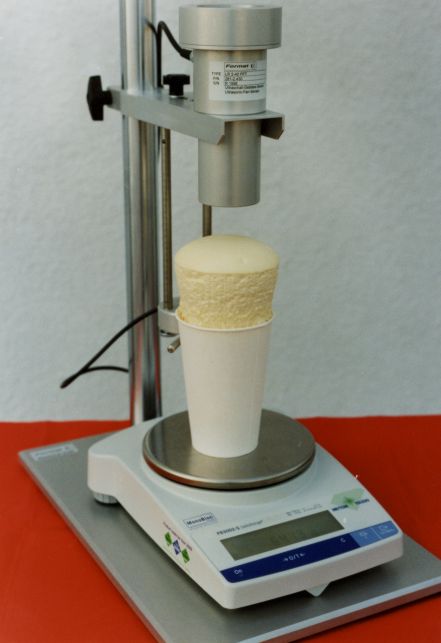
To obtain reproducible experimental data, the reaction components must be weighed out exactly. Despite the utmost care on the part of the user remnants adhering to the mixer head and remaining in the mixing cup lead to differences in the tested foam mass. Integrating a laboratory balance into the FOAMAT® system (Fig. 9) provides automatically recording the mass of each component in the batch documentation. Additionally, loss of mass due to the release of blowing agents and volatile components during foaming can be recorded continually. Determining the foam density from the mass of the finished foam sample and its final height is another advantage of an integrated balance.
Fig. 9. For measuring the loss of mass, the test cup is placed on a laboratory balance with serial data interface. |
||
|
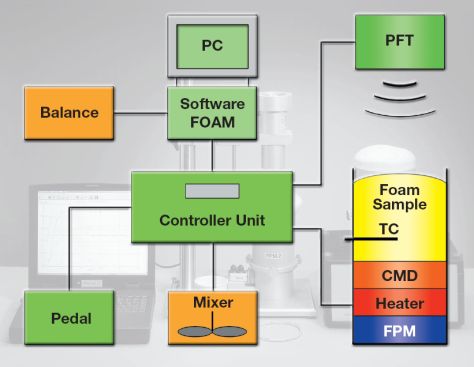
The complete Foam Qualification System FOAMAT® and its periphery is shown in Fig. 10. The mixer operation is controlled by the software FOAM according to the user’s input. The controller unit and the balance are connected to the PC. The foot switch (pedal) is used to start a measurement cycle and to operate the mixer off-line.
Fig. 10. System survey of the Foam Qualification System FOAMAT and its periphery. |
||